Section 11 · How do we communicate what we have learned?
Communicating Results
If an eval alerts in an empty forest, does it still make a sound?
Methods for communicating Evals
Communicating the results of your evals is incredibly important for converting your blood, sweat, and tears into improvements in your agent. Knowing your audience and tailoring the information you give to them is key for this to succeed.
Split into Regression and Capability Dashboards
If you're sharing results with many non-technical people or executives, most of your stakeholders will want to see a high number go up or stay stable. This kind of audience is typically juggling one hundred things at once and is too busy to dig into nuance. To make their lives, and your life, easier, show them the scores of the regression judges. These judges should typically score close to 100% and demonstrate that the product is working well. Alerts or low numbers here should trigger immediate investigations from your team.
The truly curious or invested stakeholders are those who should get access to the capabilities dashboard. The numbers here shouldn't be pretty and will demonstrate where you are in relation to where you want to be. Remember most capabilities judges are meant for hillclimbing and get converted to regression judges once you saturate the judge.
Never combine the two types of judges into a health score. This will cause undue anxiety and confusion.
Dashboard Basics
The dashboard should at least have all the information needed to understand what the judges are seeing and how they are operating. Since multiple binary judges can be aggregated per task/failure mode/capability, try to maintain this same level of aggregation across your dashboard. This means the dashboard at a minimum requires:
- The aggregated scores per task/failure mode/capability
- Count of total samples in last run
- Skip Rate per task/failure mode/capability
- Retry Rate per task/failure mode/capability
- Failure Rate per task/failure mode/capability
- Links to relevant judge eval cards per task/failure mode/capability
Eval Observability
In addition to the judge scores themselves, you should also track the health of your eval suite. Some questions to consider:
- Are any judges costing more than expected?
- Are some judges retrying often?
- Are some judges failing entirely?
- Are any judges not being run or used?
- What is the latency of the typical judge run?
- What are the error rates of each of your judges?
Tracking these kinds of stats is important because silent failures here can trigger unexpected outcomes in production and lead to loss of trust in your eval suite. For example, a judge that errors on 30% of runs but shows “pass” on 95% of its non-fail runs may not actually track the pass rate of that task at all. Maybe all 30% of the runs that result in errors are actually fail cases. Your alerts would never trigger but your user experience would still degrade.
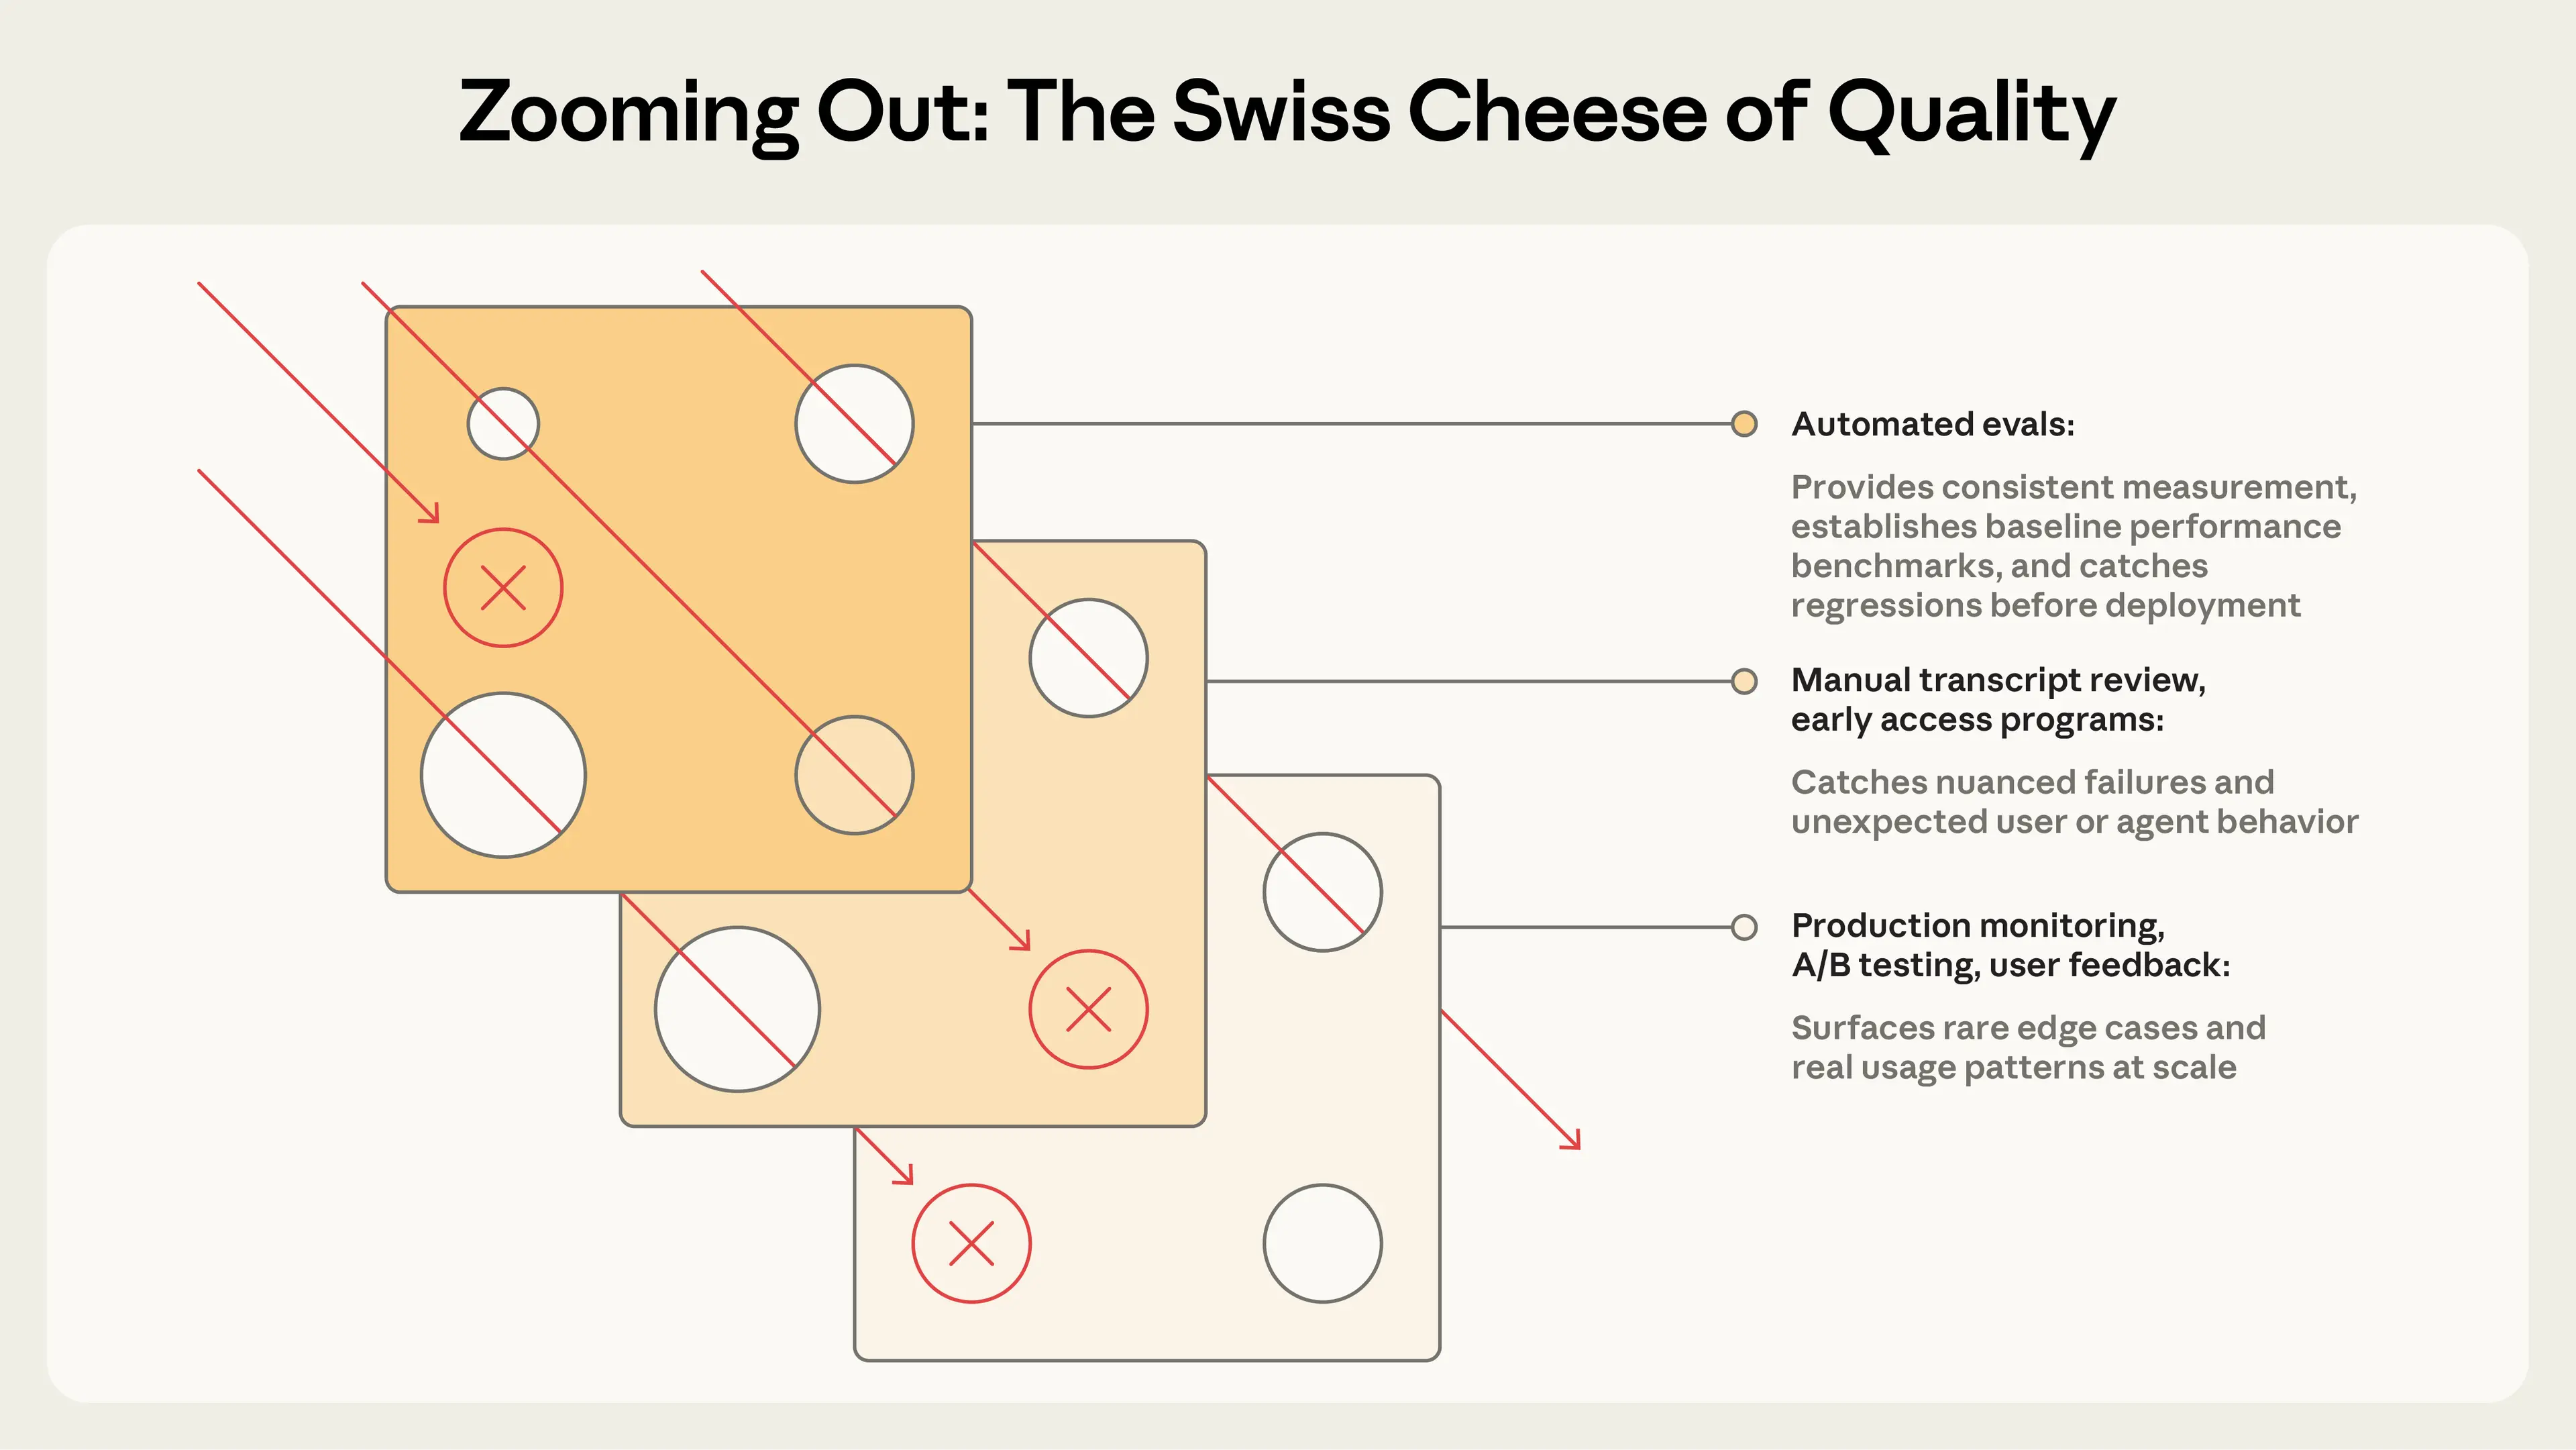
Swiss Cheese Model
This brings up the idea of a swiss cheese model from James Reason. By combining multiple layers of metrics and observations, you catch cases that may have been missed by any one layer. Anthropic's guide puts it nicely here:
Eval Cards
As we discussed in Eval Design, the eval card should travel with the number. Any time you reference a judge's pass rate, make sure to include a link to the card. This will prevent mix-ups stemming from differing agent versions, configs, or various other miscommunications that arise from not carrying the right context. Triggering a SEV because you forgot to mention a judge was a capabilities judge is embarrassing and entirely avoidable.
A filled-in eval card: the one-page design spec for a fabricated-citation judge, showing its position, dataset, privileged context, FAST checklist, calibration stats, and changelog.
Fabricated citation check
judge.cite_fabrication · owner: evals@acme
Failure mode
Response cites a URL or paper that does not resolve, or that does not support the claim it's attached to.
Motivating traces
Unit under test
End-to-end response, post-retrieval (full RAG pipeline)
Privileged context
Retrieved documents + live URL resolution results
Dataset
142 real traces + 60 perturbed variants, incl. 38 negatives (correct citations that look unusual)
Pass criteria
Fail on ≥1 fabricated citation; CI gate requires 0 fails on golden set, evidence span quoted per verdict
Expected base rate
~3% of production traces fail (last measured May 2026)
Recalibration triggers
Model swap · judge prompt edit · base-rate drift >2x · quarterly review
✓Feasible
≈$0.004 per trace
✓Actionable
quotes offending span
✓Specific
one property only
✓Testable
binary verdict per trace
Calibration · n=120 labels · last run 2026-05-28
Agreement
94%
Cohen's κ
0.81
TPR
0.92
FPR
0.04
v1.3 tightened evidence quoting after FPR spike · v1.2 added 38 negatives · v1.0 initial
Further reading